Building Blocks of Embedded Analytics
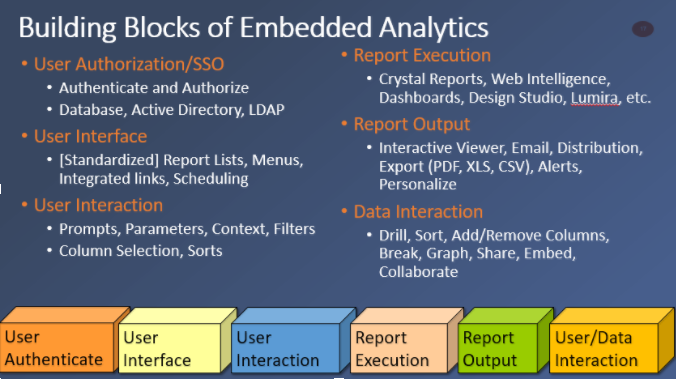
The building blocks of embedded analytics.
What we wanted to share today was just a few of the universal truths that we’ve found over the last twenty years of studying embedded analytics and delivering solutions for our customers. Whether it is embedding on-premise data in a cloud application or creating a shared reporting service any analytics solution needs a few key features in order to flow properly. We conceptualise those features into six Building Blocks that your application will need to have. Some applications only have a basic functionality in any one block but will will go much deeper into others. For instance your application may be for internal user only and your company has standardized on Windows Active Directroy (AD) making Single Sign On (SSO) straightforward. However if you are maximizing the ROI and using your analytics for both internal and external application then additional SSO methods may be necessary. Likewise how you allow users to interact with the data may be performed pre-query results or post query results. Both methods has its benefits and drawbacks but no matter the focus of your application each of the building blocks needs to be considered up front.
User Authentication, User Interface, and User Interaction compose the first layer of an embedded analytics architecture.
User Authentication
The first building block for the application is to have a single sign on function capable of authenticating users from another application and or third party identity management system. In some way the identity of the user needs to be verified and passed into the analytics solution without the user being forced to login more than once.Or even login at all, in some cases .
The main point of the authentication process is to allow access to only the content that the user is authorized for has based on the security permissions they have been granted. After the user has been identified through the parent application’s security, their authorization gives them access to the business intelligence platform or analytics platform. The user interface for this is far better as a dynamically coded security protocol rather than a hard coded html page. For example as many users keep the ecosystem of their data spread out between the cloud and on-premise systems, two great standards for communicating between cloud based applications are OAUTH and SAML. These types of standards can help to securely pass the user authentication between the layers in your BI applications across cloud and on-premise networks in a way that is easier to support and expand on as standards change.
User Interface
The second thing the application needs to have is some type of report access. This could come in the form of a menu in the parent application. It could also be a list, or even something as simple as a link or button. The user interface simply functions to provide a user, once they have passed security, with access to reporting business intelligence content.
This method is often determined by the parent application or by the application that is delivering the analytical content. For Example some applications allow for simple links or a URL to be added where others will allow a tab of HTML content be added directly into the interface.
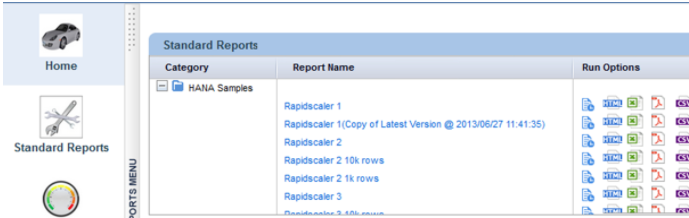
Example of Embedded Analytics
What you don’t want to do is build static html pages that are hard coded to reports that users should have access to execute. The reason for this is that, as your security changes and evolves with your software, it is much easier to implement dynamic security than hard coded security. So that the list of reports is dynamically updated, and so that, in the case of links or buttons are dynamically being updated in the user interface parallel with any changes made to the users security permissions.
It takes a bit more work to implement such a system, but it leaves the application far better equipped to deal with your evolving user base and the changes in security and permissions that entails .
User Interaction
A third thing your embedded analytics application needs is a form of interaction between the report and the user. Report interaction is where the user gets to decide what the content is within the information that they are getting back. Most often this feature is implemented through prompts. Prompts allow for parameter values that “act” on the query or report object to return on the information needed. Such actions occur before the report is run.
The user is asked through the interface what parameters they would like to place on the report such as date range, geographical area, or product line. This can shown as selectors on a screen and also be achieved through hyperlinks or drill filters coming in from the parent application. Note that the application needs to support that the prompts that are shown should only bring back a list of values based on the users level of access. This may come as part of the BI platform being connected to, but in some cases may not be available or it might be a clunky solution that requires the application to have that support explicitly added, along with with direct-to-data-source connections that adhere to any data security settings. For example, a sales person running a report with access to a specific area, be it geographically or organisationally, should only receive values pertinent to that area.
In the context of an embedded analytics solution the salesperson could have already clicked on the state of Texas within their map. At that point she is passing through the information she is looking to filter from her report based on what she selected in the parent application. Likewise, she or any other user, should not be able to change a URL and get access to data they are not entitled.
In a more advanced system you can control precisely what data within a report that a user gets access to see. As an example: if a VP of Sales user has no limits they legitimately need and are granted access to all the sales information across all regions and products for all times. But a limited user perhaps only gets access to information about what quantity of a product was sold and does not get to see the sales commission’s related to those product sales. Their access to information is limited by their security level. Where the application stores the security can be either the BI platform or the application. Each option has its own pros and cons in relation to how data interaction adheres to the security level of the user while providing the best performance.
Report Execution
In the second tier of embedded analytics architecture, there are three more key points for functionality. Report processing, storage, and distribution.
Firstly, report processing is where the really heavy work, in terms of actually generating the report, should be handled by the BI or reporting platform. The capture of information is generally going to happen through some type of query. This query may be connecting to one or more data sources. For example a report could be asynchronously connecting to a web service, a multi dimensional cube, a relational database, and a no-sql database.
At some point the system is going to be capturing the user input based on the requirements that you’ve specified in your report template. Based on the user interaction the report execution is going to be dynamically parameterized based on the report interaction and the user security. Once that data is captured it needs to be formatted. At this point the layout should be controlled by the template that you define in the BI platform to take that information returned from query and present that in the format that the user is looking for for making the decision prompting the query. An example of this is when drilling from a map to the underlying transactions shows as a cross tab by product by month for the city chosen. The layout , colors, fonts and display of totals were predefined in the report template. The data comes from the underlying query also predefined. The selection of state will have been sent at run time. All are necessary to create the expected output needed to make the next decision.
Report Output
The second part is the efficient storage of the data and metadata. At this point the end result of this report needs to taken and stored some place where the rest of the analytics process can take place. However, there is a lot of flexibility here and depending on your platform you could have several options. The storage location could be :
a) Returned to the user and not stored at all
b) Kept all in memory
c) stored on disk
d) a combination of the three.
Your requirements for Report Storage and Data Interaction will determine your preferred solution. Many platforms have restrictions on how information is stored so as to enable efficient search and retrieval processes. In other cases, especially where formatting is more important, or content needs to be accessed by users in static format, the output can be exported into network accessible storage and exported as Excel or PDF files.
User Data/ Interaction
Your application may have several requirements around the content once you get it back from the underlying platform, depending on what you want users to be able to do with it. In a highly interactive context the user will continue to author the report. This is where I, as a user, brought back the data and maybe I want to turn it from a table into a graph. Alternatively the data may be something that I just want to interact with it at different levels of a hierarchy.
An example of this would be where the report template brings the data back at a summary level, and I then want to drill through that information to the data underneath. This detailed data may be part of the original query and presentation, or it may require a secondary query or even a secondary execution of the report, parameterized further by the selection of the drilling activity. The earlier example of a map fits in well with this scenario
A third way of interacting would be filtering. In this case I’ve brought back a thousand rows, but to get the answer I’m looking for I need to filter that information.
Final Distribution
One of the reasons we do analytics and business intelligence is to help us make decisions that steer your business in the right direction. Distribution is the final piece of the puzzle that, based on your architecture, you need to determine “how do you want to exchange that information between users?”. At a basic level when saving the content do I get to choose whether it’s only accessible by my account or shared or access by my department. If the latter is true then should have ability to save that information in a way that secures it for users outside of my my department within the platform or in a network storage location with similar security controls.
The second option is to deliver the content. For instance: I’ve now understand this information and I want to email it out for someone else to view that may or may not have access to the application or BI platform used to generate the content. There are lots of different ways that distribution cab be accomplished such as emailing an excel spreadsheet or it bursting out spreadsheets every day by putting them out onto a website to be access by users with access.
In our next article we will go deeper into each of these areas of application design bringing out even more advanced embedded analytics application features.
Please feel free to comment and ask for the specifics of area that you are interested in more information on.


